Autosomal PCA charts of Europe, Near East and Mediterranean
On internet could be found many autosomal Principal Component Analysis charts, but would be no harm if we offer another one to fans of genetic genealogy.
For this one are used many genomes from publicly available collections and works, like HGDP, HGP, Behar et al, Yunusbayev et al (2011), 1000 Genomes, Hellenthal at al (2014), Western Balkans (http://journals.plos.org/plosone/article?id=10.1371/journal.pone.0105090), and others. Beside them, for PCA are used many genomes from FTDNA Family Finder or 23AndMe. There are also several ancient genomes included in PCA, Loschbour, Stutgart, BR2 and NE1. For begining, should be noticed that every spot on charts (drawn in various colours and shapes) represents one person from some of populations used in PCAs. Also, name of every population is displayed in median position (not average) on both axis.
In this PCA calculation are used about 295k of autosomal SNPs, because they are intersection between many collections and genomic products (FTDNA FamilyFinder, 23AndMe) used here. In calculation are not used any SNPs from Y or X chromosomes or mitohondria, so it is not gender biased, neither male nor female haplogroups have any influence on its results.
First, we have axis 1 (vertical) and 2 (horizontal) on next chart. As we can see, axis 2 is not of much use, especially for Europe, since axis 2 mostly shows genetic variance between North-West Africa and Near East.
Because of low usability of axis 2, most of charts will show axis 1 and 3 which are the most usable of all axis.
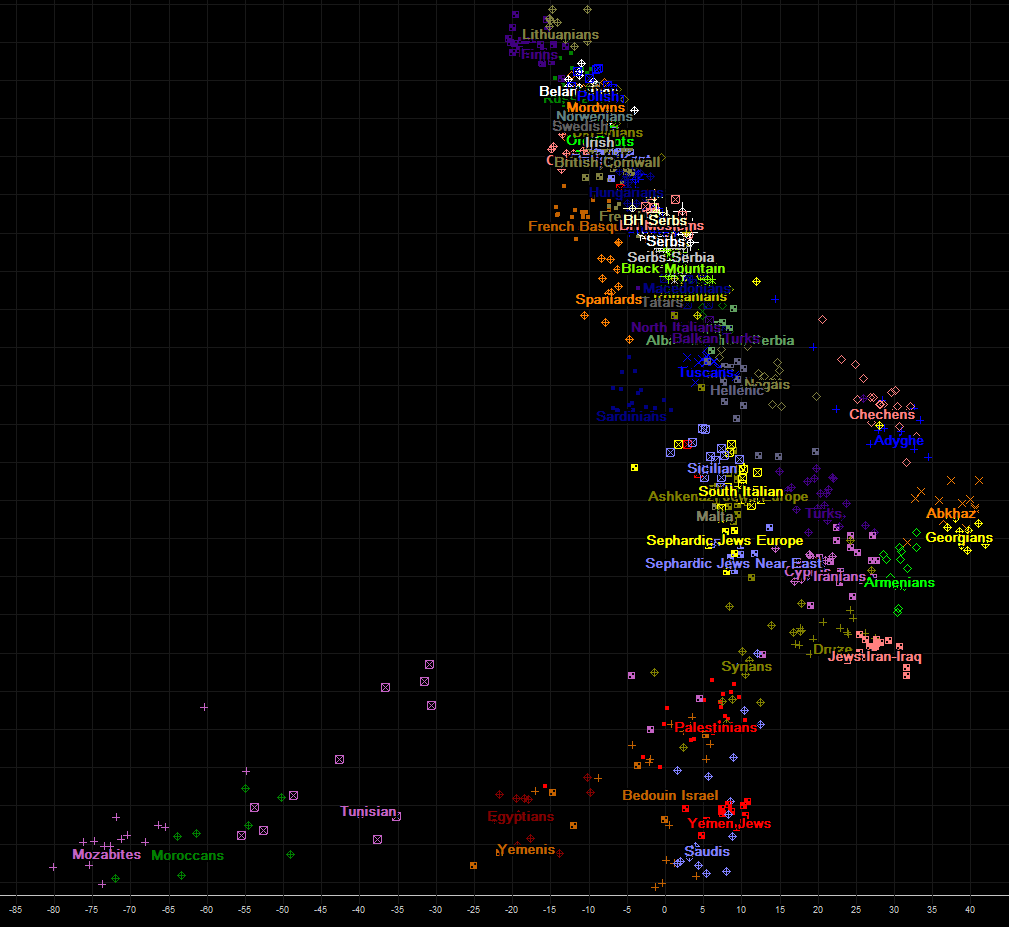
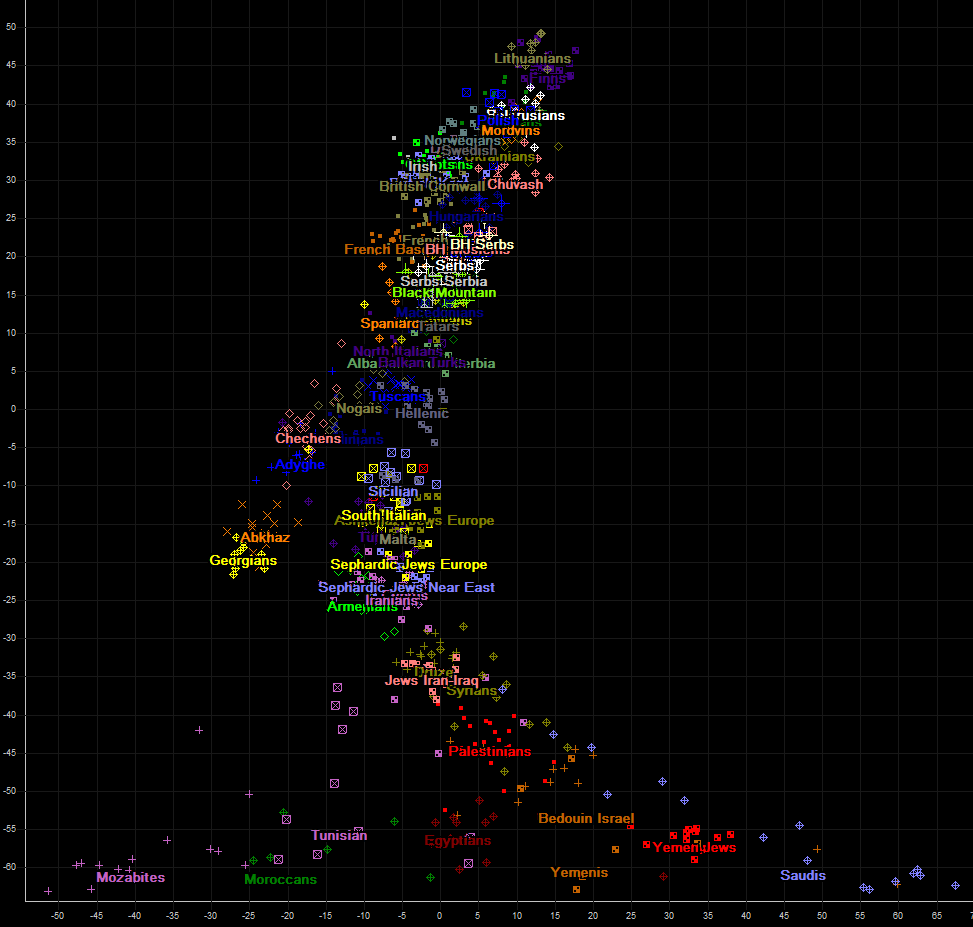
And here is overview of axis 1 (vertical) and 3 (horizontal) on next chart. Both axis are oriented so that chart resembles geographic map as much as possible. Please note lonely red symbol, that stands on top of chart, It represents ancient mesolithic hunter-gatherer genome of Loschbour, estimated to have lived about 8000 years before present, in todays Luxembourg.

Since previous chart is good as overview, different regions are not displayed so clear that various populations can be easily distinquished. Because of that, we shall in the next charts display several zoomed regions on axis 3-1.
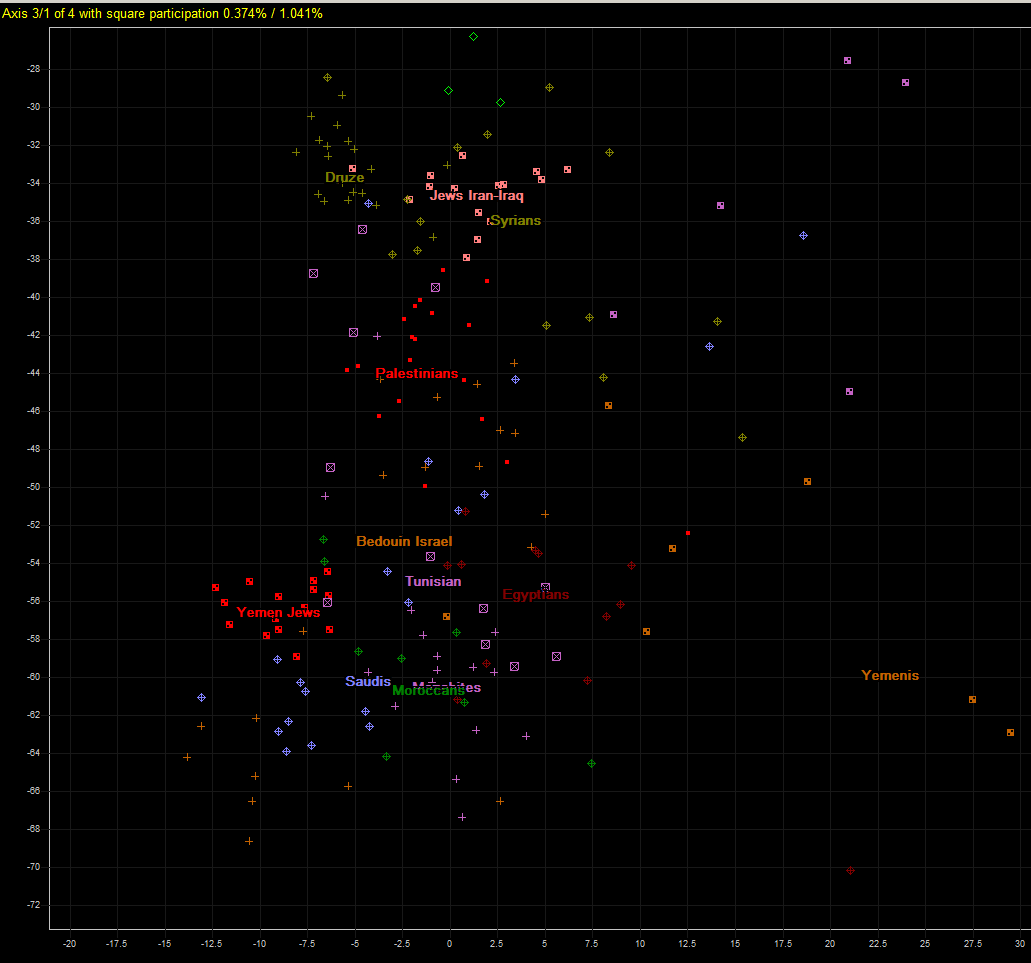
First we have zoomed part of chart displaying Northern Africa and Near East. On axis 3 they seem intermingled, unlike on axis 2.
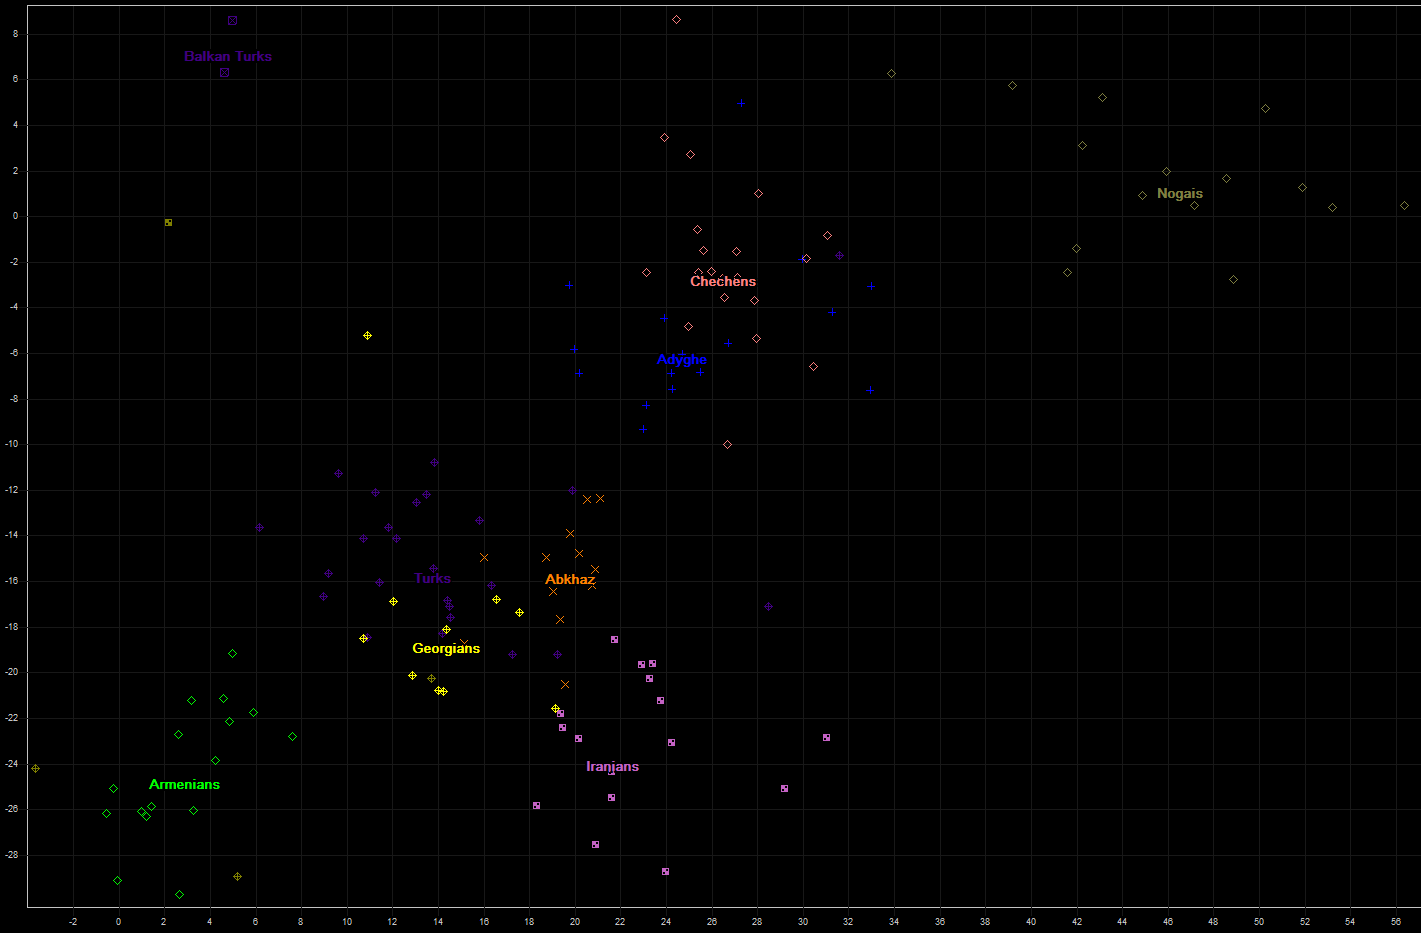
The next are several populations from Caucasus region, Anatolia, and Iranians. There are also present two samples of Turks from Balkans countries, which show great difference from their anatolian compatriots from Kapadokia region.
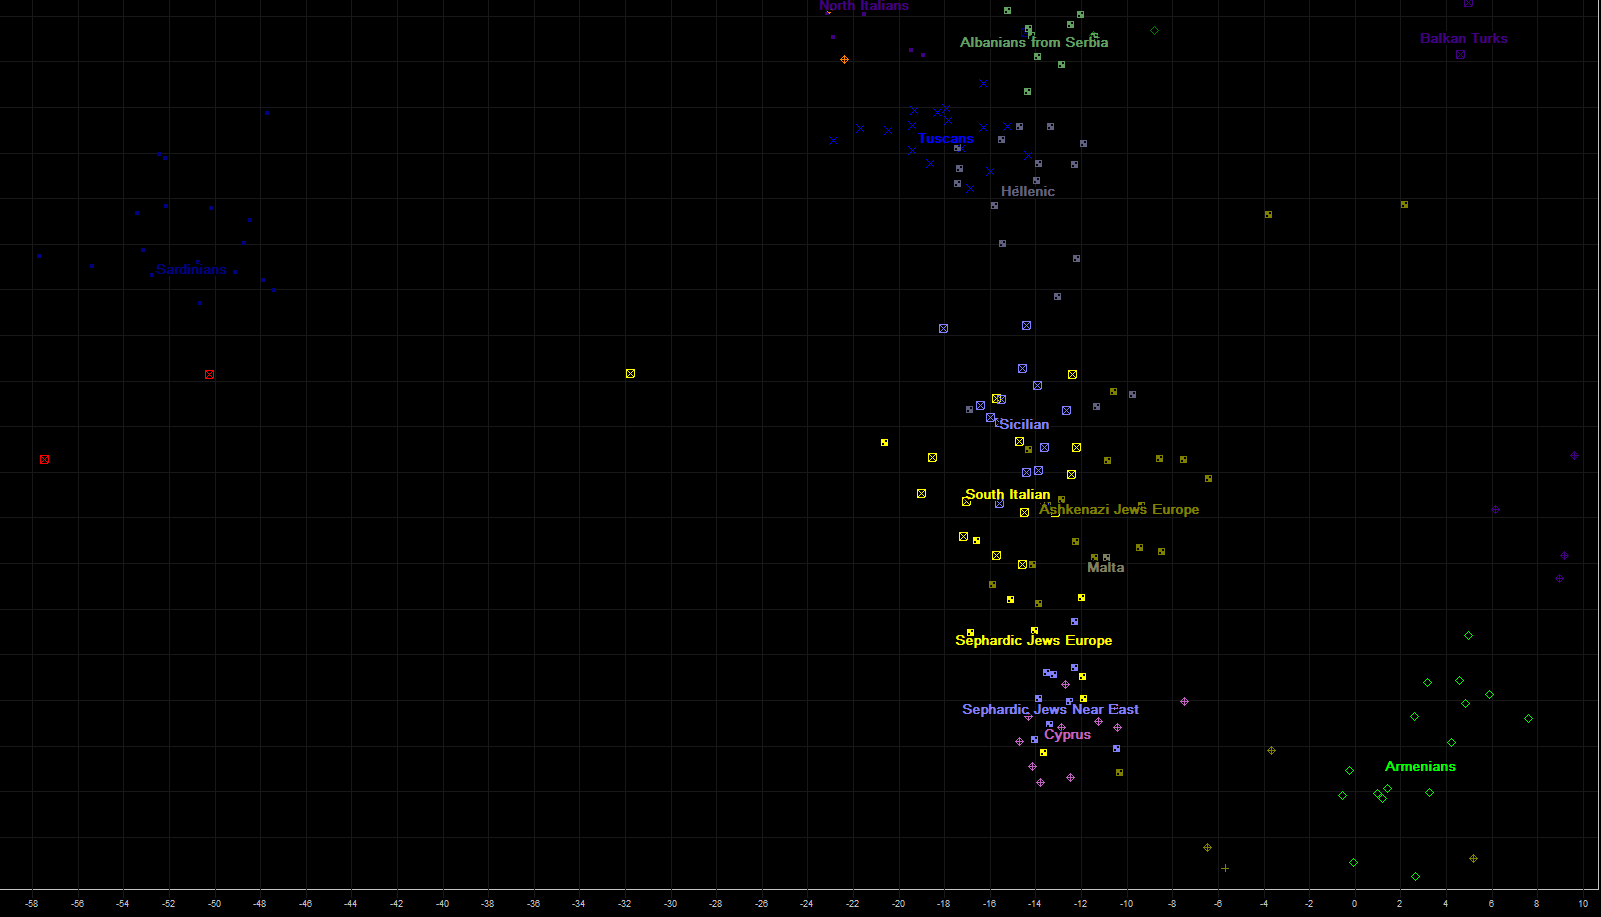
Immediately to the left from previous portion of PCA chart are positioned populations of central and southern Italy, Sicily, Greeks from Greece, Greek Cypriots, and several Jewish populations. On northern tip are positioned Albanians now living in southern serbian province of Kosovo and Metohia, whose ancestors in last 250 years had been moving gradually from Albania into southern Serbia.
On the most left side are genetically isolated Sardinians. Close to them depicted by two red squares are two ancient genomes, more left of them is famous Stuttgart genome, neolithic farmer from todays Germany, estimated to be about 7000 years old. More to the right and up is ancient genome "NE1".
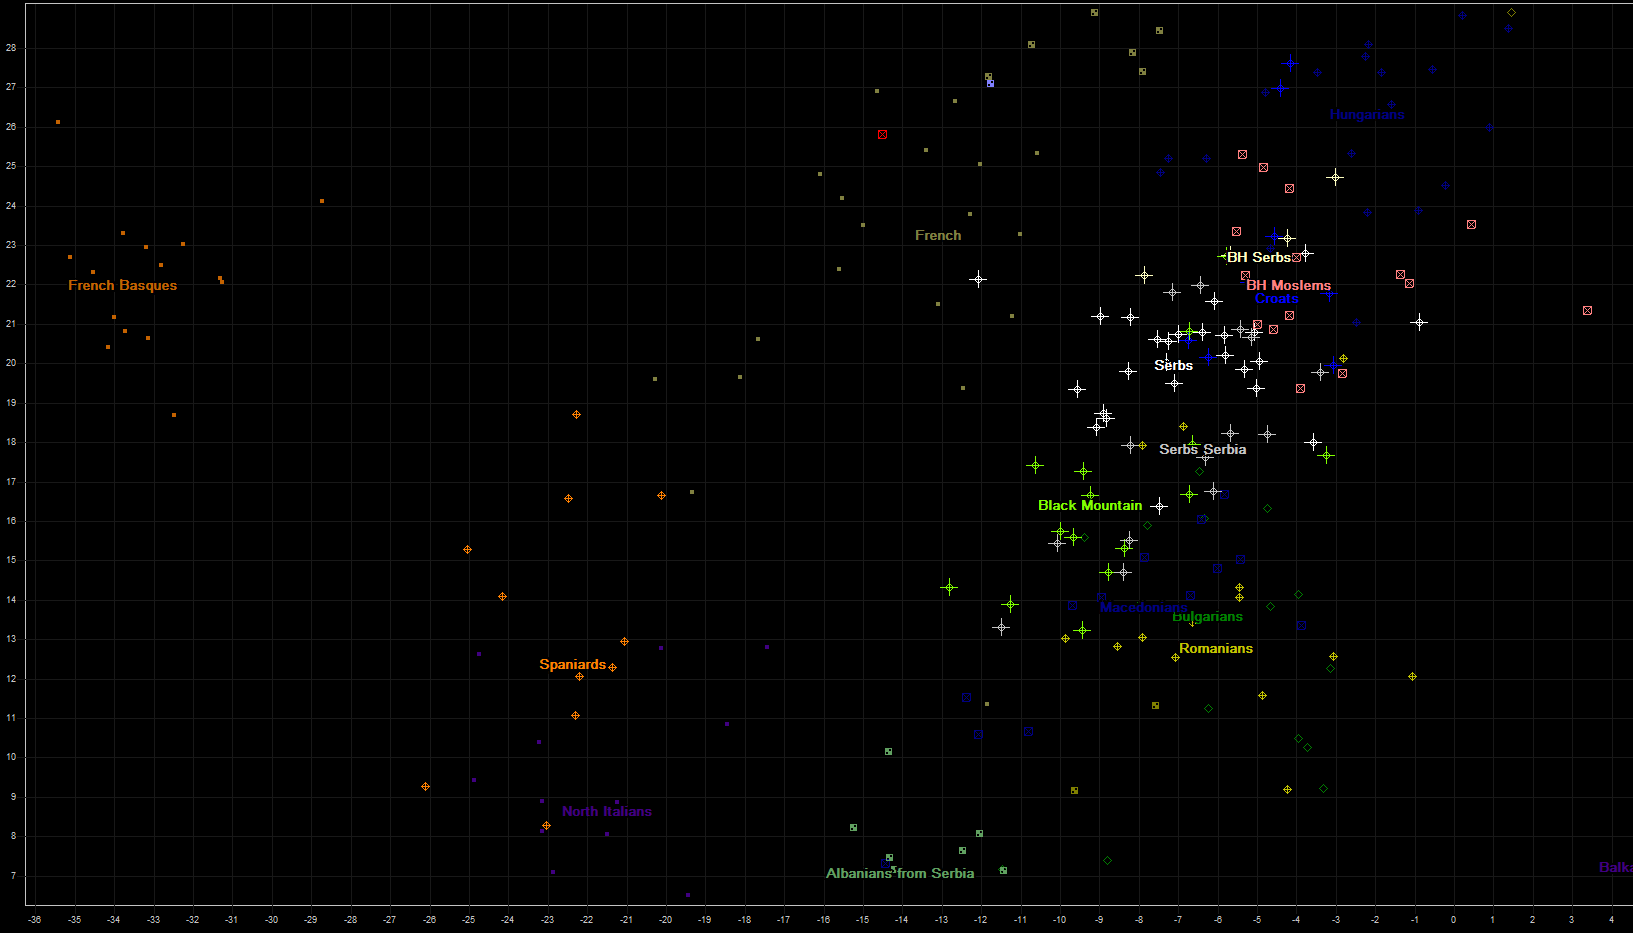
Most of Southeastern and Southwestern Europe can be found on the next chart, with parts of western (French) and central Europe (Hungarians). Populations of Balkans are here very well represented, with Romanians, Bulgarians, Macedonians, Serbs (one group from Serbia, others from Bosna and Herzegovina...), eight Croats from several regions of Croatia and B&H, and also more than 10 Moslems from Bosnia and Herzegovina.
Here we need to explain what is hiding behind name of "Black Mountain". It is small country on Balkans whose natives call it "Црна Гора", which literally means "Black Mountain", and which is better known under its italian translation "Montenegro". Since "Black Mountain" is not part of Italy, nor it has any close linguistical, ethnic, religious, genetic nor cultural relations to it, we decided to translate its name into english, to avoid its obscure and ununderstandable italian counterpart to english speakers.
Red square found in french cluster represents iron-age genome BR2, who was living in todays Hungary.
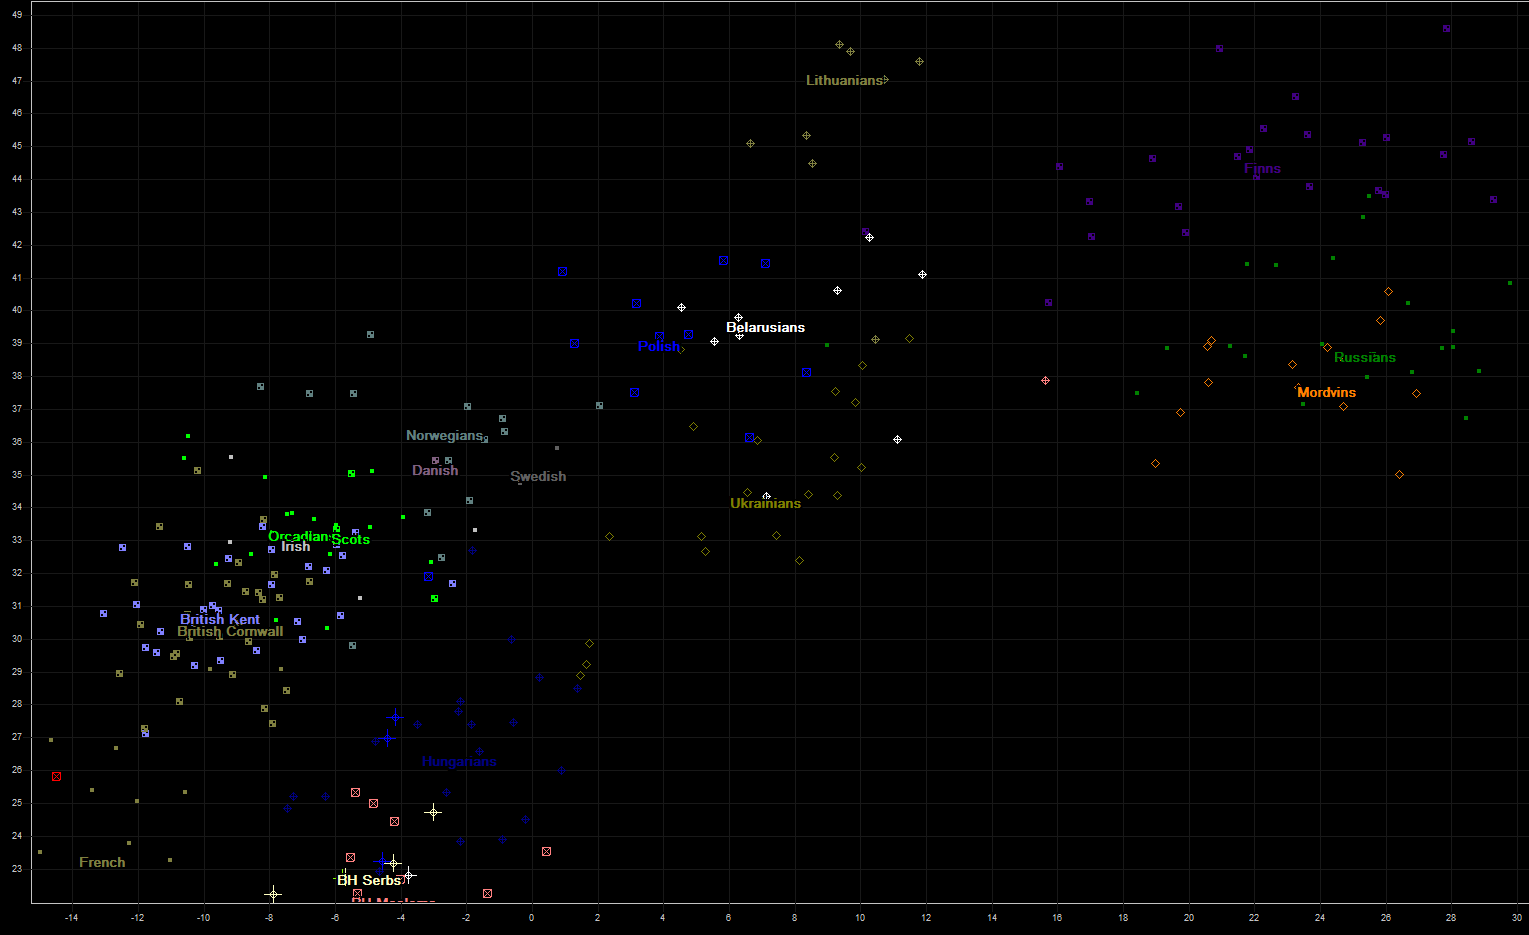
On the next chart are several populations from Northwestern and Eastern Europe. Russian samples (from HGDP collection) are all from northern city Vologda, so they look closer to Finnish than to Ukrainian or whiterussian samples. Some populations (Swedish, Danish, Irish, mainland Scots) are unfortunately represented by very small number of samples (1-4), and some very important populations are not represented at all (Germans, Switzerland, Austria, Slovakia, Chechia). If we find their samples, we shall certainly upgrade this page and charts.
And at the end of page, we display overview of axis 1 (vertical) and 4 (horizontal).
Software used for Principal Component Analysis is our own, it uses iterrative aproach for finding of several first principal components.
Page last updated: 5th november, 2016.